ionSandBox

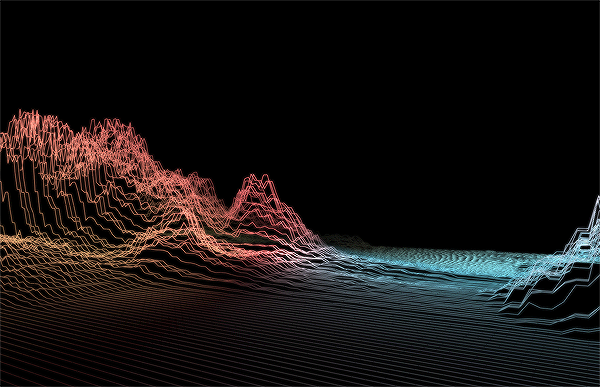


IonSandBox is software (Mac OSX only) built in Max 7 that visualizes ionospheric data made publicly available through NASA's Reverb | ECHO portal. It uses the same Python script as its predecessor ionViz to reformat the standard .ionex data file. Users of ionSandBox are given the choice of three visualization "modes": gradient map, bump map, and what I refer to as the "immersive" mode, which represents the data as a field of points or a grid of lines that rise and fall, creating a topography that can be paused and "flown" through by way of first-person camera controls. The user is also given control of the globe texturing, lighting, color, and geometry modes (lines, points, etc) of the data topographies.
Please contact me if you have any questions or comments, or if you would like to try the software


